A set of new features are now available for the Advanced Chart Editor for the XrmToolBox.
You can find an introduction video for the Advanced Chart Editor here.
Here is that we have been working on in the latest release aside from a few bug fixes:
Help text for the properties
Most of the properties now have a tooltip that gives some detail on how this property is used. Properties with help text have a subtle question mark next to them.

I’ve tried to include information about value ranges if relevant as well as details on whether or not the property is used in conjunction with other properties.
New options for save and/or publish
There are three new buttons available in the chart manager.

Delete: Deletes the chart.
Save As: Save a copy of the chart. You will prompted for a new name.
There are also two update buttons now. “Update” and “Update & Publish”.
“Update & Publish” is the existing button that both updates the chart and then publishes the entity in Dynamics 365.
The new “Update” button is maybe my favorite addition in this release. When updating user charts, simply click update, and then click refresh in Dynamics 365 to see your updates. Makes the whole process a lot faster. Hope you will take advantage.
Add Annotation Node to the chart XML
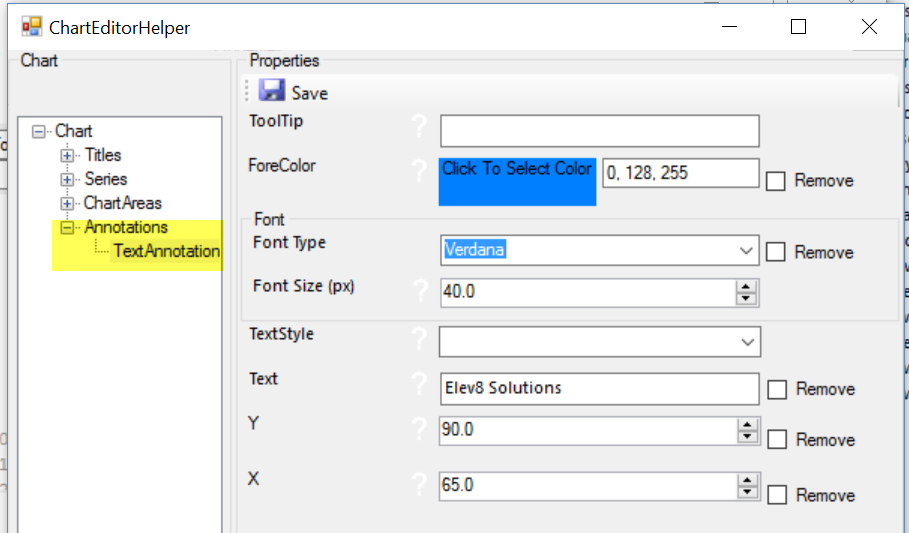
We have added an annotation node in the chart XML by default. This makes it easy to enter additional descriptions for the users or simply give your chart some nice corporate branding.
More details on how to work with annotations in Dynamics 365 here.
Here’s an example of a chart using the annotation feature
 .
.
We hope you like this update and would love to hear your comments and suggestions for the tool.
Be sure to also follow the awesome developer for the project, Mohamed Rasheed Follow @Rasheed_ITLec
And, as always please sign up for my newsletter and follow me on Twitter. Follow @CRMChartGuy

Thank you very much for this addon!
Hi Ulrik,
Can you please help me creating a chart which has all the four quadrants. I tried all the options but could not represent one.
Appreciate your help on this.
Thanks
[…] Now you can add text to your Dynamics 365 charts as demoed earlier in this post. […]
i watched your video and just downloaded xrm toolbox and tried to edit a chart, but receive an error when trying to Edit Chart…See the end of this message for details on invoking
just-in-time (JIT) debugging instead of this dialog box.
************** Exception Text **************
System.IO.FileNotFoundException: Could not load file or assembly ‘ICSharpCode.TextEditor, Version=3.2.1.6466, Culture=neutral, PublicKeyToken=4d61825e8dd49f1a’ or one of its dependencies. The system cannot find the file specified.
File name: ‘ICSharpCode.TextEditor, Version=3.2.1.6466, Culture=neutral, PublicKeyToken=4d61825e8dd49f1a’
at ITLecChartGuy.AdvancedChartEditor.Forms.ChartEditor.InitializeComponent()
at ITLecChartGuy.AdvancedChartEditor.Forms.ChartEditor..ctor(Entity chart, IOrganizationService service)
at ITLecChartGuy.AdvancedChartEditor.MainControl.tsbEditChart_Click(Object sender, EventArgs e)
at System.Windows.Forms.ToolStripItem.RaiseEvent(Object key, EventArgs e)
at System.Windows.Forms.ToolStripButton.OnClick(EventArgs e)
at System.Windows.Forms.ToolStripItem.HandleClick(EventArgs e)
at System.Windows.Forms.ToolStripItem.HandleMouseUp(MouseEventArgs e)
at System.Windows.Forms.ToolStrip.OnMouseUp(MouseEventArgs mea)
at System.Windows.Forms.Control.WmMouseUp(Message& m, MouseButtons button, Int32 clicks)
at System.Windows.Forms.Control.WndProc(Message& m)
at System.Windows.Forms.ToolStrip.WndProc(Message& m)
at System.Windows.Forms.NativeWindow.Callback(IntPtr hWnd, Int32 msg, IntPtr wparam, IntPtr lparam)
Hi Ray
Thanks for the feedback. Any chance I can have you report the issue on GitHub https://github.com/ITLec/ITLec.CRMChartGuy.XRMToolBox.AdvancedChartEditor
That’ll allow us properly work with you on it.
[…] plugin, which can be downloaded from the plugins store is called “Advanced Chart Editor” and it lets you modify the chart XML in Dynamics 365 (and Dynamics CRM) without having to export […]
Is there a way to update the sample/default data in the Chart Editor? I looked in the Config.Exe, nothing in there seemed applicable.
Thanks
Hi John. Not sure what you are looking to update. If it is generally applicable, I’ll be happy to update the default file. I did originally have more default values in the chart editor, but ran into issues where they weren’t universally applicable. If you want to try it out, have a look at the video in this post https://crmchartguy.com/2017/06/18/color-options-and-create-a-custom-color-palette-for-the-chart-editor-in-the-xrmtoolbox/ where I talk about making changes to the config file. Just be aware that any updates you make to the file will be overwritten on updates.
Ulrik,
Thanks for the reply. Maybe this is a newbie error. Full disclosure, I’m new to Dynamics and therefore these tools.
This is a working chart in Chart Editor: https://1drv.ms/u/s!Au1TW-VXQ1K3jY1mwE_6uybMhBlXsA
This is a published chart in a D365 test instance. https://1drv.ms/u/s!Au1TW-VXQ1K3jY1lIg1sWODDGZJUSg
The sample data ranges leave me with an empty working chart so I end up iterating through the publish/tweak cycle a few times so I can see the chart drawn with data. Then I go back to Chart Editor to tweak and publish again. Its not a huge issue, I just thought that if I could change the values of the sample chart data that I could save a few iterations while editing the chart.
Thanks for the great tools and blog. It has really helped shorten my Dynamics learning curve.
John
Hi John. I may have been a little too late to see your screenshots, but it sounds like you are going through a publish cycle every time you make some updates to the chart.
I’d recommend creating your chart first as a user chart in your production org. Then you can update it and see the results with real data without publishing. Tweak it as much as you like as nobody else can see it yet. Once it is ready, Export the XML and upload it as a system chart and go through your publishing process.
Hi Ulrik,
First of all – thanks for sharing an incredible wealth of knowledge! Your insights have helped me immensely!
I was wondering if the Annotations might be able to reference data from another chart? Example – we have a won/loss chart that shows rep performance per month for the fiscal year. It would be great if we could reference totals (revenue, margin, etc.) in an annotation.
Is that possible?
Thanks again,
Rick
Thanks Rick
The .Net charts do support keywords such as totals etc, from the same chart data in annotations. However, Dynamics 365 does NOT support those keywords in the annotation. It’s a very unfortunate limitation as it would have greatly increased the feature set of the charts.