I usually stick to the standard chart types in my blog posts, even though Dynamics CRM supports many other types such as radar, polar, error bar and bubble charts. So it is time to venture out a little bit.
In this post I will work with the bubble chart and show how to build one using only Dynamics CRM charts and some chart xml editing.

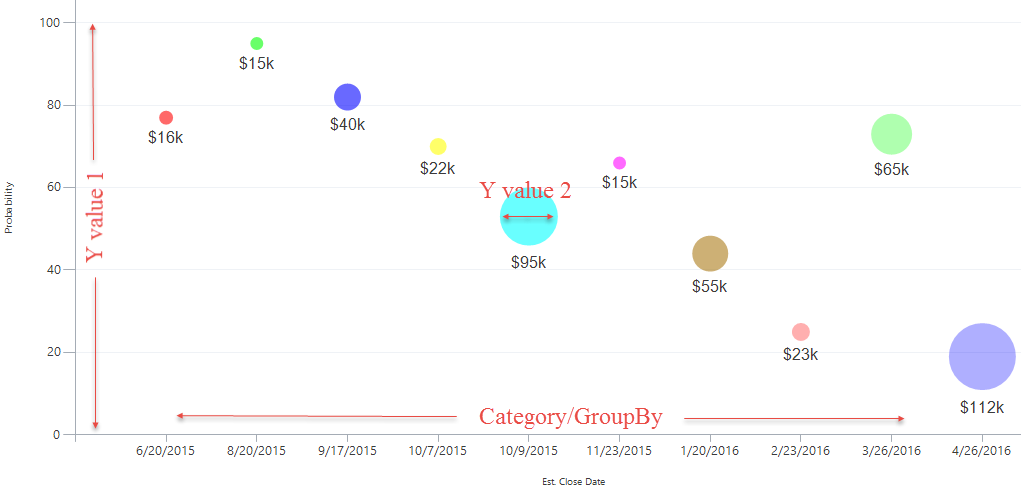
Here is the bubble chart I will build.
A couple of details on the setup. The X axis along the bottom has the Est. Close Dates, with the nearest close date on the left. The Y axis goes from 0 – 100 based on the Probability of the opportunity. In an ideal scenario, each opportunity, or bubble, will move from the lower right quadrant, to the upper left quadrant of the chart. As the Est. Close Date comes nearer, the Probability should also increase. This also makes it easy to identify opportunities that fall outside the intended path, such as having a very low probability, but set to close very soon, or a very high probability on an opportunity that is a year out.
Before you start making bubbles, we need to have a look at how Dynamics CRM renders the chart.
- X axis is defined by the GroupBy and Category in the xml.
- Y axis is the first Y value defined.
- Bubble size is the second Y value defined.
Bubble Charts initially look great, but they do have some limitations in Dynamics CRM. Hopefully I will provide enough information for you to decide whether or not bubble charts work for your scenario. I will also have some suggestions on how to overcome some of the limitations.
This post also details how to create charts that use multiple Y values, which a number of the custom chart types do.
Chart Editor – Create the base chart
Let us get started and create a base chart on the opportunity entity we can use to customize the chart xml.
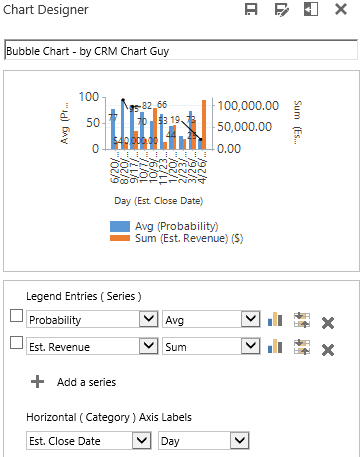
Add the two series, Y Values, we need.
- Probability (height on Y axis)
- Est. Revenue (bubble size)
Add Est. Close Date as the Category to get that on the X axis.
Now export the chart xml and let’s have a look.
Create a measure with two Y values in the chart XML
In the screenshots below, I have changed the aliases to something that reads easier than the auto-generated ones.
The important part is to identify the measurecollection. In the chart xml we exported there are two measurecollections, one for each of the two series we added.

Bubble charts need one series with two Y values. Not two series with one Y value each.
We need to modify the measurecollection so we instead have one collection with two measures, i.e. one series with two Y values.
Like this

Now that we only have one measurecollection, we also need to remove one of the two series that is in the xml. Remove everything related to the secondary Y axis at the same time as well.

Finally, change the chart type in the remaining series to “Bubble”, not depicted in the screenshot above, and import the chart xml into Dynamics CRM.

Squares!! So far, so good.
Style the Bubbles!
Squares may not be exactly what we were looking for. The bubble, or marker, is defined the MarkerStyle options which goes in the series. See all the MarkerStyle options on MSDN.
“Circle” is the obvious choice for bubble charts.
We also need to use some of the custom attributes for bubble charts. Here is an overview of bubble chart options on MSDN.
Here are the changes I made in the series of the chart xml. Full XML sample is available at the end of the blog post.

- IsVisibleInLegend=”False”
- MarkerStyle=”Circle”
- IsValueShownAsLabel=”True”
- LabelFormat=”$#,#,k”
- Font=”Arial, 16px”
- CustomProperties
- BubbleUseSizeForLabel=True
- LabelStyle=Bottom
I removed the legend because it is not needed for this chart and would be a waste of space.
IsValueShownAsLabel, LabelFormat, Font, LabelStyle and BubbleUseSizeForLabel are all related to creating the label with value of the Est. Revenue below the bubble in thousands. The last piece, BubbleUseSizeForLabel, is for displaying the second Y value as the label. Otherwise it would display the first Y value, which is the Probability. See the image with the squares for an example. More on label formatting in charts here.
Import the updated chart xml and your result should look like this.

Drawbacks
Now we have a bubble chart with nice labels. All the bubbles have the same color because they are all in the same series. That leads me to some areas that you need to be careful with when creating bubble charts.
Notable drawbacks about the bubble chart:
- Cannot identify individual opportunities
- Cannot do drill-down
- Opportunities with the same Est. Close Date will be grouped in to one bubble!
These could be some pretty serious drawbacks, but I will show you some tricks to get around them. The solutions are definitely not foolproof and should be used with care. It all really boils down to your specific scenario. However, these tricks do work best with a limited number of opportunities.
Add Bubbly Colors
First step to make this a little better is to give each bubble its own color. We can do this by adding a palette to the series itself.

I use SemiTransparent as it has some nice bubbly colors (pun certainly intended).
Adding a Palette to a series will give each datapoint its own color. It can be a useful to distinguish columns etc. in charts where only one color is used. You can only use one of the named palettes. That means you cannot create your own color scheme for this. However, there is a number of named palettes to choose from. Click here for a full list of palettes with samples.
Import the xml with the palette and you should get something like this.
Note that I also cleaned up the axes titles and intervals a little at the same time. Full chart xml sample available at the bottom of the post.
Create a “Legend Chart”
So far so good, but that does not solve the issues that I mentioned earlier. I can’t tell which bubble belongs to which opportunity. To solve this, I will make another chart, with the same color coding displaying the names of the opportunities. Basically, I am creating a chart which will serve as a legend.
This “legend chart” is build from a stacked bar chart. I will not cover the layout customization as they are detailed this post: Design Options for Bar Charts
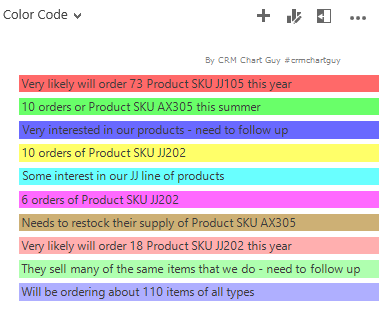
The most important part of this chart, is that the order has to match the bubble chart perfectly. Otherwise, the colors will not match. The bubble chart is grouped by, and therefore also sorted by date on the “Est. Close Date” field.
That means you need to use the Est. Close Date for the aggregation and then manually insert an order by that alias.
This is my starting point in the chart designer to create the base chart.

Here is the fetchcollection with changes highlighted. Full sample is available at the bottom of this post.

The order has been added manually and the aggregate has been changed to “max”, which allows us to group by the opportunity and not the date. Of course, also insert the same SemiTransparent palette in the series.
Bubble Chart and “Legend Chart” together

Here is the bubble chart and the “legend chart” in a dashboard next to each other. The opportunity on top of the “legend chart” matches the color of the Est. Close Date that is nearest. You can also use the combination of the two charts to check that you are not impacted by some of the bubble chart limitations. If the bubble chart had grouped some opportunities into one bubble, the first and last colors of the bubble chart and “legend chart” would not match.

Here is the final version in a dashboard.
Thanks for reading. Please sign up for my newsletter and follow me on Twitter Follow @crmchartguy
Bubble Chart XML Sample
As always, samples are provided for fun and training purposes only. Do not use in production without proper testing, and in this case, very carefully reviewing the mentioned drawbacks and limitations on this chart type.
<visualization>
  <visualizationid>{9E4D4D89-2084-E511-80E6-3863BB3CA578}</visualizationid>
  <name>Bubble Chart - by CRM Chart Guy</name>
  <primaryentitytypecode>opportunity</primaryentitytypecode>
  <datadescription>
    <datadefinition>
      <fetchcollection>
        <fetch mapping="logical" aggregate="true">
          <entity name="opportunity">
            <attribute groupby="true" alias="EstCloseDate" name="estimatedclosedate" dategrouping="day" />
            <attribute alias="Probability" name="closeprobability" aggregate="avg" />
            <attribute alias="EstValue" name="estimatedvalue" aggregate="sum" />
          </entity>
        </fetch>
      </fetchcollection>
      <categorycollection>
        <category alias="EstCloseDate">
          <measurecollection>
            <measure alias="Probability" />
            <measure alias="EstValue" />
          </measurecollection>
        </category>
      </categorycollection>
    </datadefinition>
  </datadescription>
  <presentationdescription>
    <Chart Palette="None" PaletteCustomColors="91,151,213; 237,125,49; 160,116,166; 255,192,0; 68,114,196; 112,173,71; 37,94,145; 158,72,14; 117,55,125; 153,115,0; 38,68,120; 67,104,43; 124,175,221; 241,151,90; 186,144,192; 255,205,51; 105,142,208; 140,193,104; 50,125,194; 210,96,18; 150,83,159; 204,154,0; 51,90,161; 90,138,57;">
      <Series>
        <Series ChartType="Bubble" Palette="SemiTransparent" IsVisibleInLegend="False" MarkerStyle="Circle" IsValueShownAsLabel="True" LabelFormat="$#,#,k" Font="Arial, 16px" LabelForeColor="59, 59, 59" CustomProperties="BubbleUseSizeForLabel=True, LabelStyle=Bottom, PointWidth=0.75, MaxPixelPointWidth=40"></Series>
      </Series>
      <ChartAreas>
        <ChartArea BorderColor="White" BorderDashStyle="Solid">
          <AxisY LabelAutoFitMinFontSize="8" Title="Probability" Interval="20" Maximum="110" TitleForeColor="59, 59, 59" TitleFont="{0}, 10.5px" LineColor="165, 172, 181" IntervalAutoMode="VariableCount">
            <MajorGrid LineColor="239, 242, 246" />
            <MajorTickMark LineColor="165, 172, 181" />
            <LabelStyle Font="{0}, 10.5px" ForeColor="59, 59, 59" />
          </AxisY>
          <AxisX LabelAutoFitMinFontSize="8" Title="Est. Close Date" TitleForeColor="59, 59, 59" TitleFont="{0}, 10.5px" LineColor="165, 172, 181" IntervalAutoMode="VariableCount">
            <MajorTickMark LineColor="165, 172, 181" />
            <MajorGrid LineColor="Transparent" />
            <LabelStyle Font="{0}, 10.5px" ForeColor="59, 59, 59" />
          </AxisX>
        </ChartArea>
      </ChartAreas>
      <Titles>
        <Title Alignment="TopLeft" DockingOffset="-3" Font="{0}, 13px" ForeColor="59, 59, 59"></Title>
      </Titles>
      <Annotations>
        <TextAnnotation X="50" Y="0" Text="By CRM Chart Guy #crmchartguy" TextStyle="Default" Font="Verdana, 8px" ForeColor="Gray" />
      </Annotations>
      <Legends>
        <Legend Alignment="Center" LegendStyle="Table" Docking="right" IsEquallySpacedItems="True" Font="{0}, 11px" ShadowColor="0, 0, 0, 0" ForeColor="59, 59, 59" />
      </Legends>
    </Chart>
  </presentationdescription>
  <isdefault>false</isdefault>
</visualization>
Color Code for Bubbles – “Legend Chart”
<visualization>
  <visualizationid></visualizationid>
  <name>Color Code for Bubbles - by CRM Chart Guy</name>
  <primaryentitytypecode>opportunity</primaryentitytypecode>
  <datadescription>
    <datadefinition>
      <fetchcollection>
        <fetch mapping="logical" aggregate="true">
          <entity name="opportunity">
            <attribute groupby="true" alias="_CRMAutoGen_groupby_column_Num_0" name="opportunityid" />
            <attribute alias="closedate" name="estimatedclosedate" aggregate="max" />
            <order alias="closedate" descending="false" />
          </entity>
        </fetch>
      </fetchcollection>
      <categorycollection>
        <category alias="_CRMAutoGen_groupby_column_Num_0">
          <measurecollection>
            <measure alias="closedate" />
          </measurecollection>
        </category>
      </categorycollection>
    </datadefinition>
  </datadescription>
  <presentationdescription>
    <Chart Palette="None" PaletteCustomColors="91,151,213; 237,125,49; 160,116,166; 255,192,0; 68,114,196; 112,173,71; 37,94,145; 158,72,14; 117,55,125; 153,115,0; 38,68,120; 67,104,43; 124,175,221; 241,151,90; 186,144,192; 255,205,51; 105,142,208; 140,193,104; 50,125,194; 210,96,18; 150,83,159; 204,154,0; 51,90,161; 90,138,57;">
      <Series>
        <Series ChartType="StackedBar" IsVisibleInLegend="False" Palette="SemiTransparent" Label=" #AXISLABEL" Font="{0}, 12px" LabelForeColor="59, 59, 59" CustomProperties="BarLabelStyle=Left, PointWidth=0.75, MaxPixelPointWidth=40">
          <SmartLabelStyle Enabled="True" />
        </Series>
      </Series>
      <ChartAreas>
        <ChartArea BorderColor="White" BorderDashStyle="Solid">
          <AxisY Enabled="False" LabelAutoFitMinFontSize="8" Maximum="1" TitleForeColor="59, 59, 59" TitleFont="{0}, 10.5px" LineColor="165, 172, 181" IntervalAutoMode="VariableCount">
            <MajorGrid LineColor="239, 242, 246" />
            <MajorTickMark LineColor="165, 172, 181" />
            <LabelStyle Font="{0}, 10.5px" ForeColor="59, 59, 59" />
          </AxisY>
          <AxisX Enabled="False" IsReversed="True" LabelAutoFitMinFontSize="8" TitleForeColor="59, 59, 59" TitleFont="{0}, 10.5px" LineColor="165, 172, 181" IntervalAutoMode="VariableCount">
            <MajorTickMark LineColor="165, 172, 181" />
            <MajorGrid LineColor="Transparent" />
            <LabelStyle Font="{0}, 10.5px" ForeColor="59, 59, 59" />
          </AxisX>
        </ChartArea>
      </ChartAreas>
      <Titles>
        <Title Alignment="TopLeft" DockingOffset="-3" Font="{0}, 13px" ForeColor="59, 59, 59"></Title>
      </Titles>
      <Legends>
        <Legend Alignment="Center" LegendStyle="Table" Docking="right" IsEquallySpacedItems="True" Font="{0}, 11px" ShadowColor="0, 0, 0, 0" ForeColor="59, 59, 59" />
      </Legends>
      <Annotations>
        <TextAnnotation X="50" Y="0" Text="By CRM Chart Guy #crmchartguy" TextStyle="Default" Font="Verdana, 8px" ForeColor="Gray" />
      </Annotations>
    </Chart>
  </presentationdescription>
  <isdefault>false</isdefault>
</visualization>

Great post once again :o) I seem to have a problem displaying the values – it just displays as $ K.
Cheers Maggie
Could be the custom property about bubble size for labels that is missing.
Thanks – it worked 🙂
Me again – as you can probably tell this is pretty new to me :o) – I get the following message when trying to import the legend “an error while the chart was rendering”. Not 100% sure how the alias works.
<order alias=" " descending="false"
Another cool chart. The lack of drill down option probably means I won’t be able to use it. But it’s still a cool chart. I have learned a lot about XML-editing charts from your blog.
Yes, there is no drill down on the bubble chart, but you do have it in the “legend chart”, so you can still get to the right record with a few clicks.
I have been wanting to do this for months but not being able to figure out how! The only “problem” is that you can have several Opportunities on the same date and then the legend mismatch with the colors… (Or have I misread something?). But I guess we can live with that 🙂
Awesome, now our staff is thanking me for the rest of the year!
Yeah, that is the main challenge with this chart type. Tried to get it around with the additional “legend chart” to at least highlight the issue. You can also combine it with a standard column chart, so you can easily see how many opportunities you have per date.
Beyond the legend that is created in this example, are there any mechanisms to allow for the bubbles to be separated out so that specific opportunities are listed separately, even if they have the same Est. Close Date? Is there any other way than the legend to identify each opportunity and make it clickable?
Not that I have found, which is why I am mentioning it so prominently in the post. You can, as mentioned in the comment above, combine it with a column chart to see how many opportunities you have per date. Another option is to add more series of bubble charts. One series for each sales stage for example. You would still have the same issue with the date grouping, but the risk is lower since you are breaking the opportunities into smaller groups. If you do that, you can’t use the mentioned trick with creating a legend chart.
[…] Bubble Charts in Dynamics CRM […]
[…] Bubble Charts in Dynamics CRM […]
Hii,
I want to block a perticular chart in moca.
Is it possible to do so using Xml.?
Thank you very much CRMChartGuy … This blog has been a life saver.
Thank you for your Greate Post.
I can’t understand how to change the label value below the bubble(second Y value).
My bubble size look like the second Y value,but the label show first Y value.
Hi reimei
You may have missed the custom properties part with BubbleUseSizeForLabel=True
Thank you for your reply,
I modified the chart’s xml file as your post(also check “BubbleUseSizeForLabel=True”).
As I mentioned,the bubble radius size showed the second Y value correctly,but the label value show the second Y value.
Here is my xml file,would you give me some adivice if there are any mistake in my xml file.
{B40B975D-473C-E711-80F4-480FCFF2D601}
bubble chart
new_follow_policy_list
false
I need a graph like this, but is it possible to do this:
Is it possible that the color of the bubble depends on a range of values?
That is, if it is less than -1, the color is red.
If the value is between -1 to 1, be yellow.
And if the value is greater than 1 be green