Here’s a couple of design options to improve bar charts, fix some pet peeves of mine, or simply change things up a little.
Those pet peeves are truncated labels and always putting the top record on the bottom. Fortunately, both of those can be fixed as seen below.
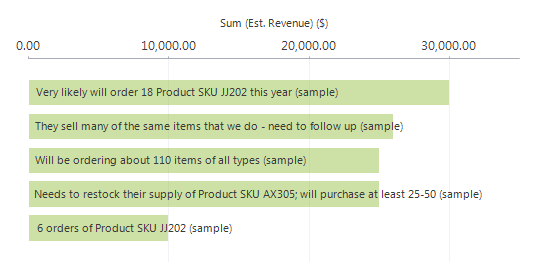
I’ve also positioned the labels on the inside of the chart, which is a better utilization of space.
Top X Charts
If you make a Top 5 Bar Chart, you get this.

It has always puzzled me that the “top” item is on the bottom. Nobody want’s to see their name on the bottom of a list. My first idea was to change the order in the xml from descending=”true” to descending=”false”. While that will reverse the order of the Bar chart, it will also only return the bottom 5 records rather than the top 5. Good to know if you ever need to make a bottom x chart of something.
Turns out the xml modification is even easier. Add IsReversed=”True” to your AxisX properties and you now get a Top 5 Bar chart with the top record on top.


Truncation of Axis Labels
Label truncation is particularly annoying when users name all their records something like “Campaign for xyz” or “Opportunity for xyz”. All you see on the labels are the “Campaign for…”. Somehow the “…” always contains the most important part.
To fix that, plus a few other modifications, I’m going to:
- Add the axis label to the bar series, to get the label on the inside of the chart
- Left align the axis label via Custom Properties
- Make the bar color semi-transparent so it’s easier to read the labels
- Increase the text size a little
- Remove current truncated labels by disabling the X axis
- Use a StackedBar chart type

There are 4 spaces in front of the #AXISLABEL. That is to control the positioning and ensure the label doesn’t start before the bar does.
Font is increased from 9.5px to 11px.
ARGB colors was used to add transparency. In this case a little over 50% transparency.
Custom property BarLabelStyle=Left is added to make sure the labels are aligned along the X axis.
StackedBar is used instead of a Bar chart, because that, in conjunction with BarLabelStyle=”Left”, forces all the labels to start along the axis. On a Bar chart the label may move right, till the end of a short bar. Even when it’s left positioned.
On AxisX; IsReversed=”True” to get the top item on top, and Enabled=”false” to remove the original truncated labels.
Hope you liked it. Please sign up for new posts or follow me on Twitter Follow @crmchartguy

The IsReversed=”True” does not import with Orion CRM 2013
I haven’t had any issues with it on CRM 2013.
Can I have three bars on same chart? One for total cases, one for resolved and one for open cases? I can do that with two separe charts but it would be better if all the info are in one chart.
Yes. The method is similar to this post. https://crmchartguy.wordpress.com/2013/03/10/aggregate-total-on-top-of-stacked-column-charts-or-bar-charts-in-ms-crm-2011/
Is it possible to have the Label & the value on each bar?
i.e. I want to still keep the Value as the label but not have the Axis label truncated
Hey I found the answer to this using the #VAL and changed the label like below;
Label=” #AXISLABEL #VAL “
Hi Kevin. Thanks for sharing. The only downside of the #VAL is that you cannot apply formatting to it. Not an issue if you are working with low numbers though, but in the thousands and higher it can get difficult to read. Your other option would be to create two identical series and display them on top of each other. That way you can format and position the two labels individually, but you may run into issues with labels overlaying each other in certain situations. What works best depends on the individual situation.
Hi. Thank you for your wonderful posts! I have following queries related to CRM Charts.
1. How to get top X (where X=5, 10 or any number) data/rows in a given chart
2. I have field as total hours which only shows aggregate for count & count non-empty (its a text field). So how do I convert it to an integer or a number to get the total.
Thank you
Hi. I would like to correct my above query. The total hours field is an option set in CRM. If it would have been decimal or currency, then addition would have been possible. So is there a way to convert to decimal inside XML code.
Thank you
[…] This “legend chart” is build from a stacked bar chart. I will not cover the layout customization as they are detailed this post: Design Options for Bar Charts […]
[…] This is clearly candidate for a Top X chart. Read more about those here. […]
Thanks for the great post ❤
[…] Duplicate detection rules generally have longer names that will be truncated on the axis. To avoid the truncation I’ve removed the axis and instead display the name on the bar itself. The process is described in this post. […]
Hi, I just installed on premise 8.2.3 update that came out Nov. 14 2018 and the IsReversed=”True” behavior is now reversed? Had to set “False” to get my top 10 charts to behave like described above. Not sure if this was intentional change?
Perhaps 8.2 Service Update 20 introduced this change in bevahior
“The x-axis displays on the top rather than the bottom of bar charts”
https://support.microsoft.com/en-ca/help/4343503/service-update-20-for-microsoft-dynamics-365-8-2-2
You mentioned in one of your posts the ability to go from 5 items in a series to up to 9 (and in some special cases 10). I cannot figure out how to add additional series. Can you point me in the right direction?