Ever had the need to count the unique number of items in MS CRM 2011, or MS CRM 2013 for that matter.
For example, not only show how many Activities were created in a given month, but also how many different people owned those Activities.
The chart editor in CRM 2013, which is remarkably similar to the one in CRM 2011, allow the following options for aggregates.
- Average (avg)
- Count:All (count)
- Count:Non-empty (countcolumn)
- Minimum (min)
- Maximum (max)
- Sum (sum)
The option to only count unique items is added to the chart xml and it only works with the countcolumn aggregate.
- distinct=”true”
Cases and Customers
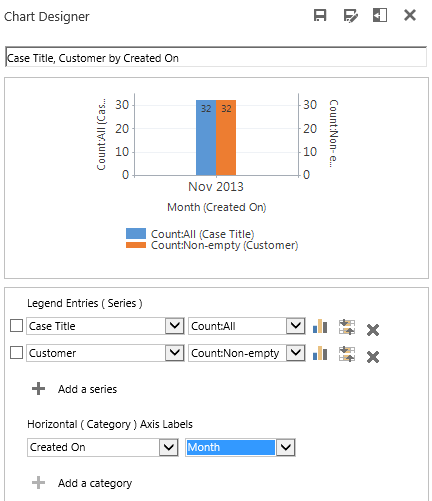
To show how to use it, I’ll use the case entity and create a chart with cases created per month, but also show how many different customers those cases belong to.
As usual I’ll try to use the chart designer to do most of the work for me.
For the Customer field, I’ve selected Count:Non-empty, which is the only aggregate that works with distinct=”true”.
Notice that both columns have the same height.
Export the chart xml and open it up in an editor.
Find the attribute for the customers, which is also the only one that have the countcolumn aggregate. On this line insert distinct=”true”.
Before importing the chart back into MS CRM, check the series and delete references to a secondary Y axis if there are any.

Now we are ready to import the chart and here’s the result.
Cases for the month and how many unique customers those cases belong to.
Notes:
When using distinct=”true” make sure you are using it on a field which has an ID. For example, opportunityid, accountid, contactid, systemuserid, etc. If you use distinct=”true” on a name or topic field, then items with the same name count as one. So two contacts named John Smith would only be counted as one.
Hope you liked the post. Please sign up for either the email newsletter or follow me on Twitter Follow @crmchartguy


Thank you CRM chart guy! This definitely got me started, but I’m still seeing the (blank) show up on x axis. I’ve tried moving distinct=”true” around, but it doesn’t seem to make a difference. I read online that there are other users that this is happening and Microsoft recommended putting in a ticket. Is there a problem with the system?
Are you using countcolumn? You should not have any blanks in that series, so if you do, there’s definitely something wrong. It’s not something I have experienced in either 2011 or 2013.
Thanks, Fantastic!!
Hey Guys, just a heads up with this great feature. It works great while in one environment but if you include the modified chart (with distinct=true) in a solution and try to import that solution into another environment – you get a Error – XML invalid message. So although the chart engine can interpret this fine, the CRM Solution importer (at least in CRM2013) does not recognize this as a valid XML statement and hence does not allow import of such a solution. I have reported this to Microsoft, so lets hope that they fix it i following releases of CRM2013 🙂
Thanks for the input Martin. I wasn’t aware of that issue.
Not fixed in 2015 or 2016 either. Distinct=true makes the solution un-importable.
Hi, thanks for all this great info – is there a way (CRM 2013) to do Timeline charts – to show how contact statuses change over time? Thanks.
Thanks for writing this article! We followed the step-by-step and the chart is looking good. However instead of showing the month/year on the x-axis (like “November 2013” on your example), ours is showing “blank”. Is there any particular variable that we need to change to show the month?
Thanks much.
Thanks for this!
I followed this this guide and look good! Saves a lot of hours working!
Hi Chart Guy,
Is it possible to chart the number of cases logged and resolved in a 7 day period?
My logic is cases creadtedon date for logged and cases modified/status = resolved for resolved.
How can you present that with the days of the week across x axis?
Thank you
This is almost exactly what I want to do, but it’s not clear what happens if you plot both November and December and a customer has a case in both months. Does “distinct=true” mean the customer is only counted in November and not in December or will they be counted in both months?