Somehow I have managed not to write about the Pie Chart in Microsoft Dynamics CRM. What you can do with the pie chart is fairly limited since only one series is supported.
However, there are a number of custom properties we can use to tweak the appearance of the pie chart.
Custom properties can be found at the end of the series properties. Note that unlike standard properties, custom properties are all added within the quotations of the CustomProperties.

The custom properties we can use on a pie chart in Dynamics CRM are:
- PieDrawingStyle
- PieStartAngle
- PieLabelStyle
- LabelsHorizontalLineSize
- LabelsRadialLineSize
- PieLineColor
- MinimumRelativePieSize
- CollectedThreshold
- CollectedThresholdUserPercent
- CollectedColor
- CollectedSliceExploded
- CollectedLabel
- CollectedLegendText
- CollectedToolTip
I’ll go through each of these properties and add some notes along the way. There’s an XML sample of a series at the bottom of the post with all the custom properties added.
PieDrawingStyle
- Default (Default)
- SoftEdge
- Concave
Changes the appearance of the pie chart. Yes, the default value is called Default.


For simply changing the appearance, another option is to change the Area3DStyle to true. Although this is not a custom property.

PieStartAngle
The PieStartAngle is a value between 0 and 360 degrees depending on where you want the first value to start. Microsoft Dynamics CRM pie charts by default start in the 3 o’clock position. That means the 3 o’clock position is 0 degrees and any changes have to take that into account.

PieLabelStyle
- Inside (Default)
- Outside
- Disabled
PieLabelStyle moves the label inside, outside or disables them completely.


The following four custom properties only apply to pie charts where the PieLabelStyle is set to outside.
LabelsHorizontalLineSize
Specifies the size of the horizontal segment of the callout line, as a percentage of the chart area.
Value range 0-100. Default is 1. Set to 0 to hide it.
LabelRadialLineSize
Specifies the size of the radial segment of the callout line, as a percentage of the chart area.
Value range 0-100. Default is 1. Set to 0 to hide it.
PieLineColor
Any named color, RGB, ARGB or HEX value can be used. See more about colors in MS Dynamics CRM charts here. Default is Black.
MinimumRelativePieSize
Specifies the minimum pie size. Value range 10 – 70. Default is 30. This property has no effect unless the outside label style is used.
Labels and Keywords
When creating a pie chart, the IsValueShownAsLabel=”True” is already added to the chart XML by default. This is what shows the values inside the chart. These values can be formatted by adding the LabelFormat property to the series. Go here for formatting of values in CRM charts.
If you want to customize the content of the label, IsValueShownAsLabel must be set to “False”.
The two properties on a standard pie charts that can hold custom text and keywords are Label and LegendToolTip. Both of these properties must be added in the series. This is included in the sample XML series at the bottom of post.
Here are the keywords that can be used in pie charts. They should be rather self-explanatory. While the last three work, they are not very useful on a pie chart.
- #LEGENDTEXT
- #VAL
- #PERCENT
- #TOTAL
- #MIN
- #MAX
- #FIRST
- #LAST
- #INDEX
Here’s a sample of what the Label and LegendToolTip could look like with keywords added. You can combine both text and keywords as needed.
Label="#LEGENDTEXT #PERCENT  -  #VAL out of #TOTAL total"
LegendToolTip="#LEGENDTEXT #PERCENT  -  #VAL out of #TOTAL total"
And here is how the pie chart looks with the Label.

And with the LegendToolTip.

The LegendToolTip only appears when the mouse hovers over the legend item. Unless changed, the tool tip will show the percentage by default. It’s redundant to show the legend text here, but the option is there.
Label, LegendText, and keywords can be used in the series of other chart types too.
CollectedThreshold
A lot of the pie chart’s custom properties are associated with the CollectedThreshold. The feature combines smaller values into one larger pie slice. This can be useful especially when you have a lot of smaller values that you can’t tell apart anyway.
When using the CollectedThreshold, you must set IsValueShownAsLabel to False. Otherwise an incorrect value will be shown for the collected slice. Only the value of the first collected item will then be shown.
CollectedThreshold
Any value lower than the CollectedThreshold will be be in the collected slice.
CollectedThresholdUsePercent
If set to true, CollectedThreshold must be between 0-100 and is then defined as a percentage.
CollectedColor
Can be any named color, RGB, ARGB or HEX value. More on colors in CRM charts here.
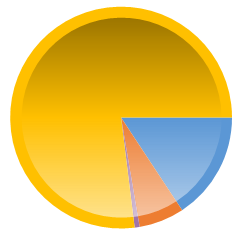
CollectedSliceExploded
If true, then the collected slice is exploded.
CollectedLabel
Your label for the collected slice. Supports keywords.
CollectedLegendText
The text in the legend. Supports keywords. Customized legend text is only supported for the collected item.
CollectedToolTip
Text in the tool tip for the collected slice. Supports keywords.

Notes on collected
Keyword #MIN is now the collected value, so it cannot be used to show what the minimum value inside the CollectedThreshold is.
Add keyword #TOTAL only to the CollectedLegendText and the total value will appear only once on the chart.
Include a description of how the CollectedThreshold is defined in the either the CollectedLabel or the CollectedLegendText. That way, the user can better decode the information..
Stuff we unfortunately cannot do with Pie Charts in Dynamics CRM
- LegendText – can’t be changed. Except for collected
- ToolTip – have no effect
- LabelToolTip – have no effect
- Exploded – custom property, have no effect.
- Keyword values cannot be formatted
Yes, you cannot add formatting to keywords, even though the documentation says you can. You’ll get a chart rendering error in Microsoft Dynamics CRM if you try to add it. This makes keywords pretty useless when dealing with large numbers. I have reported the issue to Microsoft, so if you have a minute, please go vote for the case here, and hopefully we can soon unlock even more chart features.
Note that with IsValueShownAsLabel=”True” label formatting in Dynamics CRM charts can still be used.
The documentation for all the pie chart properties can be found here. http://msdn.microsoft.com/en-us/library/dd456674(v=vs.110).aspx
Sample XML of a Pie Chart series with all custom properties.
<Series	ChartType="pie" ShadowOffset="0" IsValueShownAsLabel="False"
	Font="{0}, 9.5px" LabelForeColor="59, 59, 59"
	Label="#LEGENDTEXT #PERCENT  -  #VAL out of #TOTAL total"
	LegendToolTip="#PERCENT  -  #VAL out of #TOTAL total"
	CustomProperties="PieDrawingStyle=Concave,
			  PieStartAngle=270,
			  PieLabelStyle=Inside,
			  PieLineColor=Black,
			  LabelsHorizontalLineSize=1,
			  LabelsRadialLineSize=1,
			  MinimumRelativePieSize=10,
			  CollectedThresholdUsePercent=True,
			  CollectedThreshold=10,
			  CollectedColor=Tan,
			  CollectedSliceExploded=True,
			  CollectedLabel=Collected #VAL - #PERCENT,
			  CollectedLegendText=Collected - #VAL out of #TOTAL total,
			  CollectedToolTip=#VAL out of #TOTAL total">
  <SmartLabelStyle Enabled="True" />
</Series>
The sample series can be used to replace the standard series generated by the chart editor.
Thanks for reading. If you have a tip or trick for pie charts that I haven’t found, please include them in the comments. And of course, please sign up for the newsletter to be up to date on new blog posts and follow me on Twitter Follow @crmchartguy

Hey – another great post! Thanks. FYI, the link to the MS case is broken…
Thanks for letting me know. It does seem to work from my end, but the page does require you to log in with an MS Account ID first. The case number is 833523 and you can search for it here. https://connect.microsoft.com/dynamicssuggestions/SearchResults.aspx?SearchQuery=833523
You still need to log in before you can see the case though.
I’m logged in and I searched for the case and it didn’t come up. Wishful thinking tells me it’s been resolved? 😀
[…] Big thanks to CRM Chart Guy and his post on all things pie chart. […]
Great Post. Thanks. Question: Does anyone know a way to format the KEYWORDS? i.e. it is displaying the #TOTAL (sum of sales) as a crazy long number that is unformatted. would love to be able to change this to a currency format…
Great Post! Really helped me a lot! One question: Any idea how to format the label, so that it does not overwrite other labels? I have some small chunks (which are on purpose are not collected) and the value (shown outside and only percentage) are partially lying on top of each other, so it is impossible to read them. Also the lines indicating to which part of the pie the percentage is belonging are not shown.
I added the values like this (inside the correct context of course”): CustomProperties=”PieLabelStyle=Outside, LabelsHorizontalLineSize=1, LabelRadialLineSize=1, PieStartAngle=270″
Would be happy for a hint…
Thank you!
KR,
Maren
Hi,
Really Great Post!!
I got a question though, Can we show the total count of all parts? for eg. I have slice1 with count 400, slice 2 with 35 etc, so I want to show the total of all slices as the axis label may be.
Is it possible somehow?
Thanks. There are some descriptions on how to use the #TOTAL keyword for this purpose throughout the post.
[…] The next obvious thing to try, is to put in Label=”#PERCENT” and set IsValueShownAsLabel=”False”. Why not? It works great for pie charts. […]
I have a question. When working on a bar chart you can insert a format of Format=”0’%’” on the Y axis to remove the decimals. How can this be done on a pie chart?
Unfortunately that is not possible. The percent label on pie charts are added using keywords like #PERCENT, which MS CRM for no good reason does not support formatting of.
that is what I was afraid of
I’m trying to show the dollar amount Won and Lost on a pie chart but I also would like to show the percentage. So far, the code I write shows me either the dollar amount or it shows me the percentage – it’s never both. How can I accomplish that?
Is there a way to pull values directly from a page to show in a pie chart on that page? For example, I want to show a budget pie chart whose components consist of fields on that budgetary page, NOT from the subgrid on the page. That way, I can have field values shown that reference the budget overall, and not just each subitem that is related to the budget.
It should consist of five values that come from the same page – the active entity.
[…] to pie charts, funnel charts only allow one series and one Y value per point. It also cannot be combined with any […]
Hi,
thank You for your post, but I still have a one question. Could I create a border between parts in pie chart? I need 2px white line between each line in my chart, but I don´t know if its possible, or how can I do this?
Thank You,
your blog helped me a lot with my work in MS Dynamics.
Awesome stuff and thanks! This may have been asked and sorry if it is repeat, but can you use Pie Charts to show roll up data, e.g. I am a manager and have 3 direct reports. They have opp’s that we code with a risk/issue tag, such has hot, warm and cold. Can the Pie chart show three slices (hot, warm and cold) and then within each slice show who the owner is?
Partially. We are using the pie chart to show the first level. In our case, the amount of budget that is committed, reserve, or discretionary. I do not think it can go one level deeper though – to show the elements within each pie slice that roll up to the higher level slice.
The chart explode and Chart percent are not working… I want this feature 😦
Please Help me
I have been reading the other blog posts regarding how to show columns/priorities that do not have a count. My company divides tasks into on-time and late and our pie chart legends change color and does not look uniform among users (i.e. someone with on time and late tasks has two colors, while the other who has all on time tasks has a chart with the “late” color). I considered using the dummy records you mentioned, but since pie charts are a count it will add a record to each of the categories. Do you have any recommendations on this?
Hey I want pie chart to be show the slide as exploded, but this one is not working for me. Can you please hel me.
Unfortunately the exploded option is not supported in Dynamics 365 on the pie chart. It only works for the collected slice.
Hi,
may it be the case that most of these changes won’t work for the Dynamics CRM mobile app?
Or did I miss something here?
(in my case the PieLabelStyle did work, but the Threshold didn’t. Same goes for LineBreak at column charts, that didn’t work.)
Thank you in advance
Hi Dennis. Yes, the mobile app is kind of doing its own thing. Some customizations are ok, while others are overridden.
Hi, thanks for the post. I did a few customizations to a pie chart but for some reason, the #VAL which is a count of the quoteid is returning 1.5 instead of 1. I haven’t found any information around this issue, do you have any idea what could be happening? Thanks!
Hi,
Useful one. But the same is not working foe Stacked Column chart. Any idea how to customize the tooltip in Stacked Column?
Hi CRM Chart Guy,
thank you for another helpful post.
Since my pie chart has more than 7 pieces, could it be, that there is a maximum of shown values, if PieLabelStyle=Outside?
Thanks in advance for any reply.
BR